


COMPANY
NEWS
2025-04-15
How to choose handheld spectrum analyzer for your application
Selecting the right handheld spectrum analyzer is a process that requires comprehensive consideration of application needs, key performance parameters, ease of use, and long-term support. The HAROGIC PX series of handheld spectrum analyzers, with its wide frequency range, excellent performance, portable and reliable design, and capability for second development, aims to extend your RF boundaries.
1 Introduction-Spectrum Analyzer Fundamentals and Applications
A spectrum analyzer is an instrument applied to deeply measure and visualize target signal characteristics in the frequency domain, time domain and modulated domain. It is a key tool in fields like radio frequency engineering, telecommunications and electronics for analyzing signal characteristics, identifying interference or troubleshooting systems. Here is an introduction to the main types of spectrum analyzers:
1.1 Classification by analysis method
Swept-Tuned Spectrum Analyzer: This classical analyzer tunes a local oscillator (LO) to mix with the input signal for every target frequency point. The intermediate frequency (IF) signal is filtered and its amplitude is measured by a digital detector before displayed on the screen.
FFT-Based Spectrum Analyzer: The main difference between the swept-tuned analyzer and FFT analyzer is the method used to analysis the IF signal. For the FFT analyzer, an FFT analysis instead of voltage detection is applied to get the amplitude of the IF signal. Since the FFT method can obtain amplitude information of up to thousands of frequency points in a single conversion, making it much faster than the voltage detection method in many cases. FFT analysis is a key capability for a modern spectrum analyzer. It is not recommended to consider any spectrum analyzers that only provide swept-tuned analysis. At present, most mainstream spectrum analyzers provide FFT analysis and swept-tuned analysis simultaneously, and excellent spectrum analyzer products will also provide more than 25 MHz of analysis bandwidth and more than 1K FFT analysis points to obtain higher FFT analysis speed.
Real-time Spectrum Analyzer (RTSA): RTSA is a further enhancement of FFT analyzer, which greatly enhances the signal processing capability of intermediate frequency and can provide continuous and dead-zone-free FFT analysis of intermediate frequency signal, thus obtaining a very strict and accurate relationship between signal spectrum and time. RTS usually has much higher analysis bandwidth and analysis speed than ordinary FFT analyzer, and can provide the best measurement experience.
1.2 Classification by application scenario
Benchtop Spectrum Analyzers: Regarding benchtop spectrum analyzers,there is a huge difference between the low end of desktop spectrometers and the high end. Low-end desktop spectrometers, designed to provide a physical form suitable for desktop operation, usually do not have good RF performance and analysis capabilities due to compromises on cost, and are not recommended without severe cost constraints.
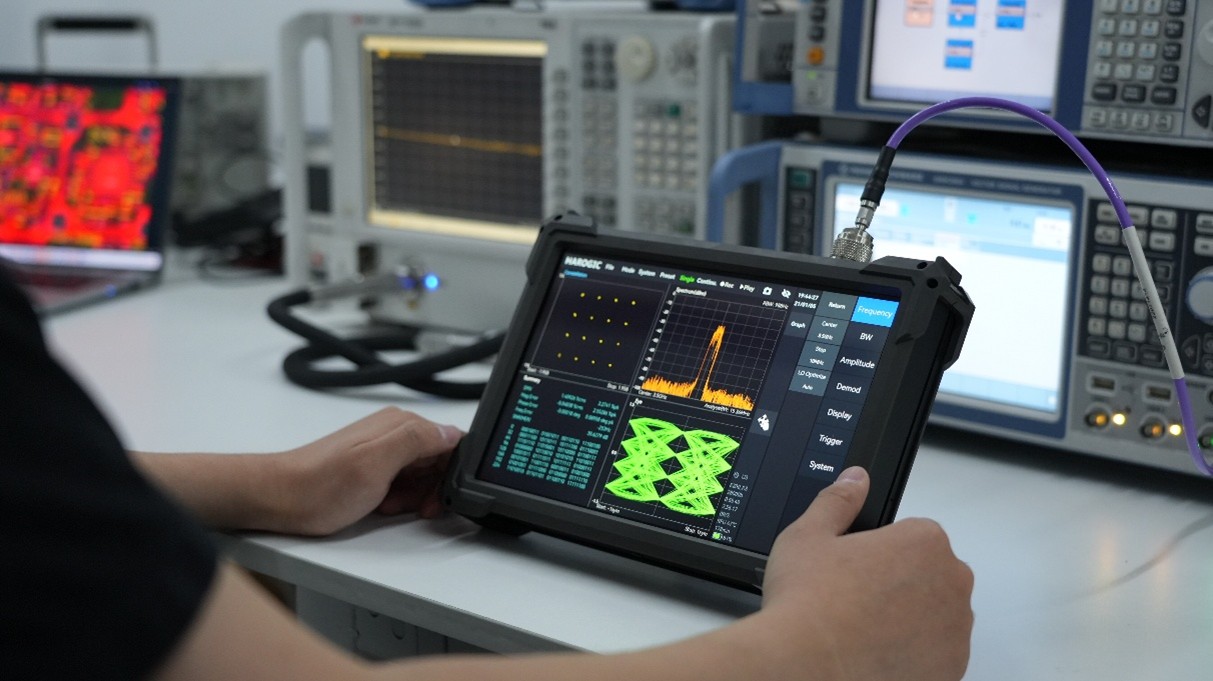
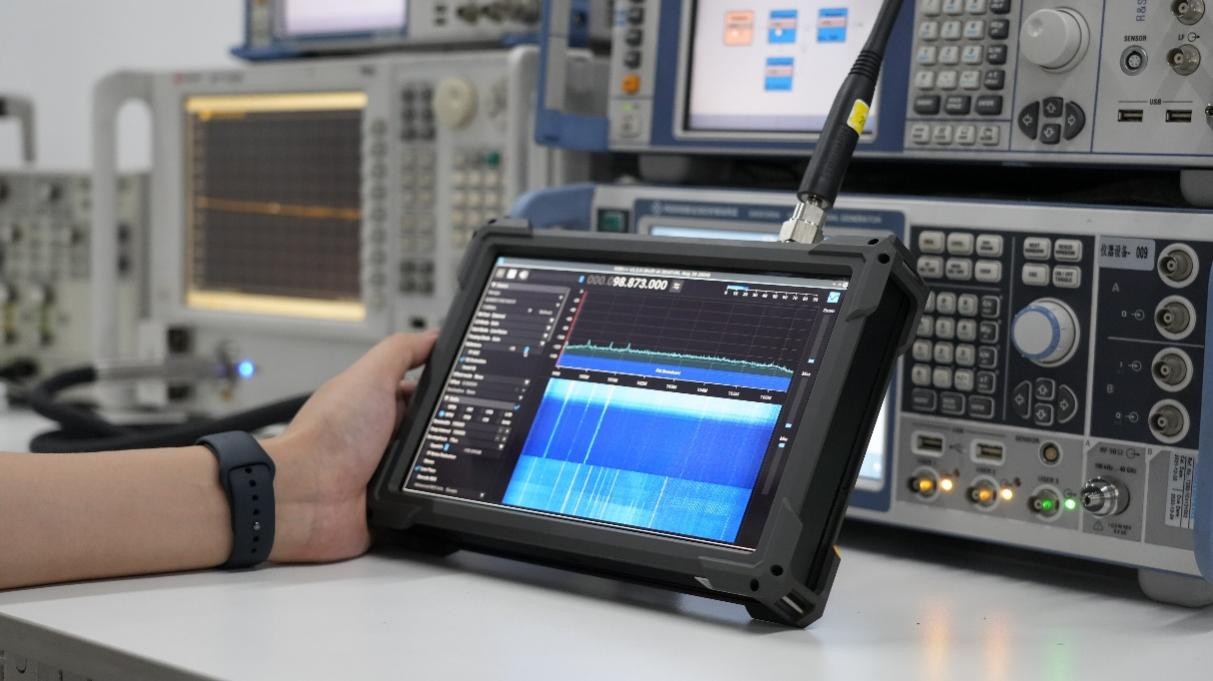
Handheld Spectrum Analyzers: battery-powered and optimized for field test and measurement, and trouble shooting. With the continuous development of technology, the latest handheld spectrum analyzers can provide good RF and analysis capabilities, even better than most low-end desktop spectrum analyzers, including real-time spectrum analysis. Some advanced products can provide 8-inch or even larger touch operation, and the interactive experience is even better than some desktop devices, with multiple adaptability for both field and laboratory use. If a handheld spectrum analyzer can provide good performance while ensuring portability (less than 3kg), it will be the best choice for field applications. It is also recommended to choose an excellent handheld spectrum analyzer to replace a low-end desktop spectrum analyzer to reduce duplicate investment.
USB (Software-defined) Spectrum Analyzers: A USB-based spectrum analyzer uses a computer host for parameters configuration and measurement result display. USB spectrometers are typically modular and weigh only a few hundred grams, providing excellent portability and integration into a wide range of application scenarios.The performance of USB spectrometers spans a wide range, with some simple USB spectrometers not delivering true instrument-grade performance metrics, but some advanced USB spectrometers deliver performance comparable to low- to mid-range desktop/handheld spectrometers.
2 How to Choose your Handheld Spectrum Analyzers-Key Parameters for Considerations
Handheld spectrum analyzers (HSA) are attracting more and more attention because of their improving performance, portability, and effective on-site test support. In this article, we will introduce the key parameters for choosing an HSA and give some brief highlights of the HAROGIC PX series handheld real-time spectrum analyzer up to 40 GHz.
2.1 Key parameters for choosing a HSA
Frequency range: specifies the span of frequencies within which a handheld spectrum analyzer can operate. It must cover the signal frequencies for the target application. Consider your applications, such as cellular networks (Sub-6 GHz, millimeter-wave), WLAN (2.4/5/6 GHz), and satellite (L, S, C, Ku bands, etc.).
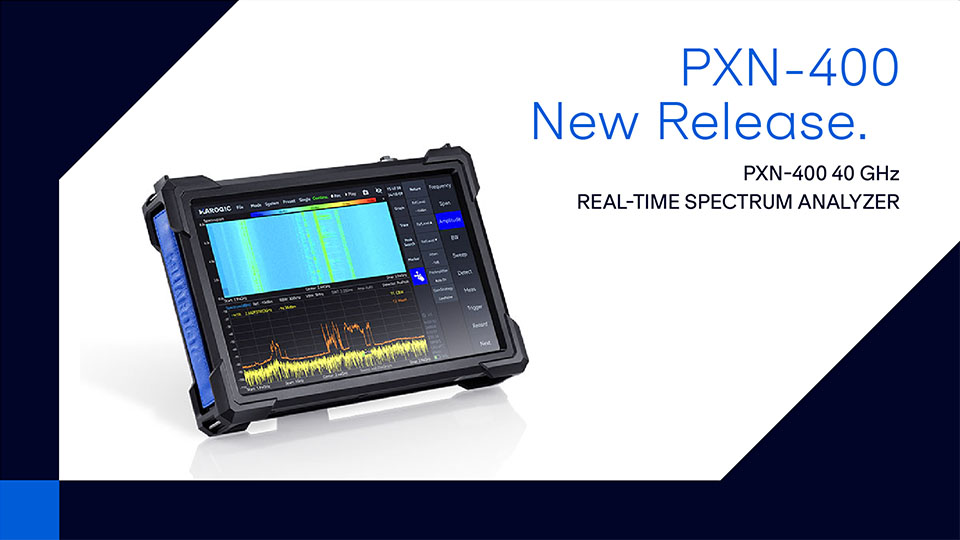
Choosing a range wider than your highest operating frequency is generally safer. For example, when engineers develop and test a WI-FI router, they just need an HSA with frequency range up to 6.3 GHz when they want to measure the channel power of the target WI-FI signal. If they want to check the spectrum purity of the Wi-Fi signal including third harmonics, the frequency range of the HSA should cover at least up to 18 GHz. HAROGIC PX series HSA offers models with different frequency ranges, which starting from 9 kHz to 9 GHz, 20 GHz, and 40 GHz. A frequency up to 40 GHz already meets the needs of the vast majority of field applications.
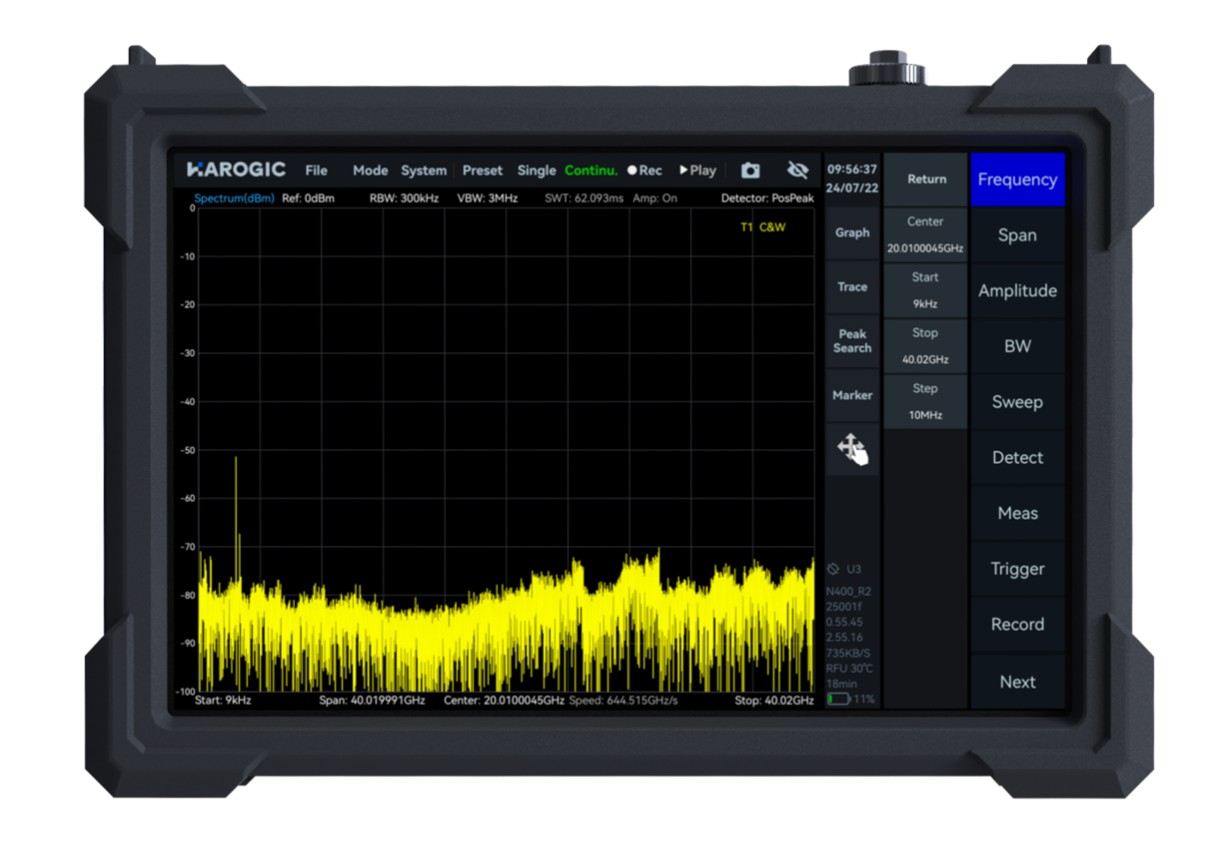
Sweep Speed: Scanning speed is one of the most critical indicators that affect the user experience. Excellent indicators should be based on good scanning speed, otherwise the long analysis time will make you unbearable. For example, even if a spectrum analyzer has a DANL of -160 dBm/Hz, if its analysis speed is very low, in most cases users have to use a larger RBW to keep the scanning speed within a tolerable range, such as 10 seconds. For the PX series products, it has the highest level of analysis speed on the market and provides high-speed analysis capabilities under most settings. The PX series allows users to complete a 10GHz frequency range scan in tens of milliseconds at a 100kHz RBW. The high scanning speed allows users to use a smaller RBW to achieve a wide frequency range scan, obtaining an effective dynamic range far beyond that of ordinary handheld spectrum analyzers and desktop spectrum analyzers.
For the PX series, it has a very high sweep speed on the market and provides high-speed analysis capability in most settings. The PX series allows users to scan a 10 GHz frequency range within tens of milliseconds at 100 kHz RBW, and the high sweep speed allows users to use a smaller RBW to achieve a wide frequency range, obtaining an effective dynamic range far beyond the common handheld and entry-level benchtop spectrum analyzers.
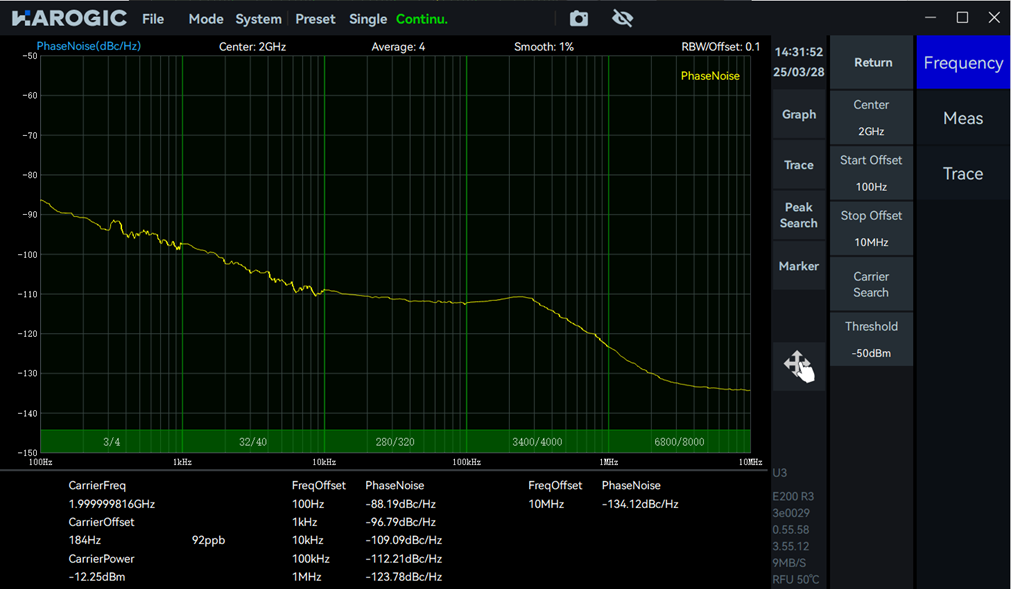
Spectrum purity: the ability of an HSA to measure a signal with minimal phase noise or spurious signals. The key aspects of spectrum purity are phase noise, spurious signals, and harmonics. Low phase noise is crucial for distinguishing closely spaced signals, measuring narrowband signals, and evaluating modulation quality (such as EVM). Moreover, fewer and lower-level spurious signals ensure that the HSA itself doesn’t introduce interference signals that could be mistaken for actual input signals.
HAROGIC PXN-400 40 GHz handheld spectrum analyzer has a typical phase noise level of -107 dBc/Hz@10 kHz offset at a 1 GHz carrier. The typical spurious is <-65 dBc. HAROGIC spectrum analyzer software SAStudio4 also provides customers with standard phase noise measurement mode for easy phase noise measurement.
Dynamic range: refers to the instrument's ability to simultaneously measure large and small signals. A wide dynamic range is crucial for detecting weak interfering signals near strong carriers. It is typically influenced by specifications such as the noise floor (DANL) and the third-order intercept point (TOI).
Look for a low DANL (Displayed Average Noise Level) and a high TOI. A preamplifier can lower the DANL and improve the ability to measure small signals, but it may affect the TOI.
Maximum Input Power: the maximum signal power that the spectrum analyzer's RF input port can safely withstand. When working near high-power environments such as transmitters, it is essential to ensure that the instrument is not damaged by overload.
Check the specifications for maximum continuous input power and peak power. Understand if the instrument has built-in overload protection.
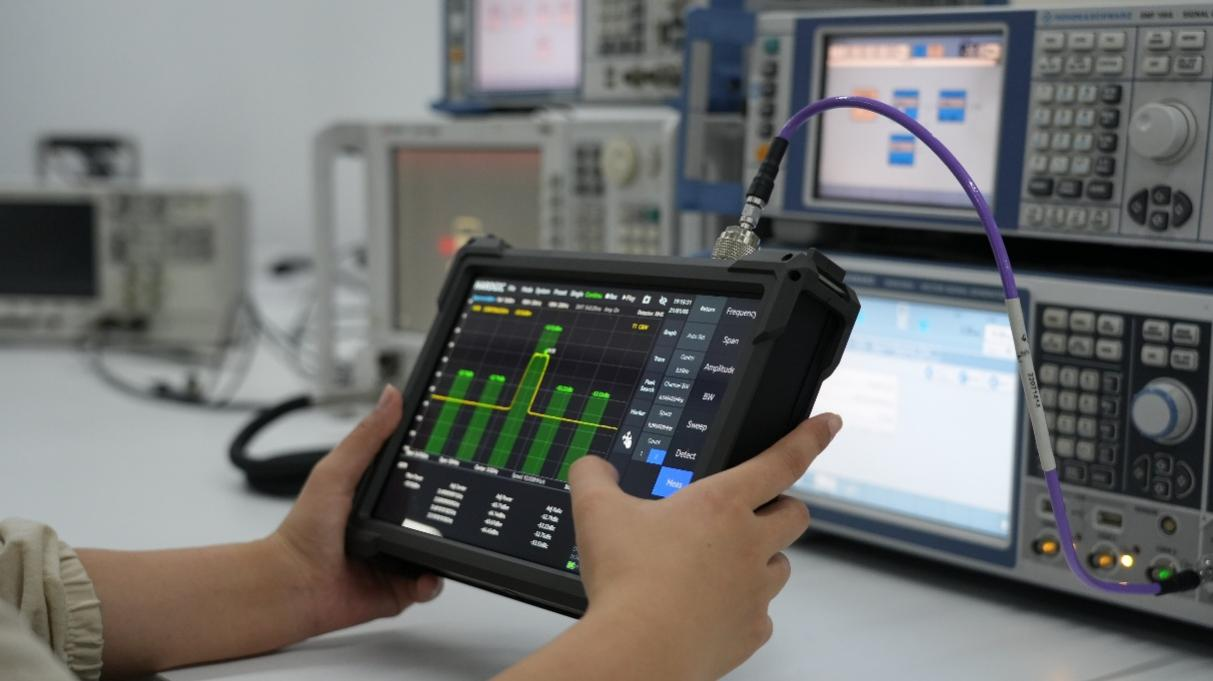
Measurement Functions: Beyond basic spectrum parameters, consider whether you need specific automated measurement functions when choosing an HSA to improve efficiency and standardize testing. Choose based on your application needs. Common functions include Channel Power, Occupied Bandwidth (OBW), Adjacent Channel Power Ratio (ACPR), Spectrum Emission Mask (SEM), Field Strength Measurement, Interference Analysis (such as waterfall diagrams/spectrograms), AM/FM demodulation, and digital demodulation. Some advanced instruments also support signal analysis for specific communication standards.
HAROGIC PX series handheld spectrum analyzer is featured with various measurement functions as standard, including channel power, OBW, ACPR, AM/FM demodulation, and digital demodulation. You will not need to make a duplicate investment to include more options.
Portability and Battery Life: Field and on-site testing often take place away from the office, so instrument weight and battery life directly impact work efficiency. Choose an HSA with low weight and a battery that can support continuous use for at least a full workday (e.g., 3-6 hours). A replaceable battery design or extra power bank support is also a significant advantage.
HAROGIC PX series HSA has a weight of only 1.5 kg, making it easy carry for field measurement. At the same time, the battery working period is 3 hours as standard, and power bank supply is also supported for longer operating time.
Scalability and customization: A handheld spectrum analyzer may also allow users to develop custom applications tailored to specific needs, such as RF measurements, data acquisition, or signal processing tasks like specialized spectrum monitoring or signal direction finding. These features broaden the potential applications of handheld spectrum analyzers, empowering engineers and technicians to fully adapt these devices to unique or advanced use cases.
Another standout feature of the PX series is its highly compatible Application Programming Interface (API), which is designed to facilitate secondary development, bypassing the need to rely solely on HAROGIC’s SAStudio4 software. This means users—such as engineers, researchers, or system integrators—can customize the analyzer’s functionality or integrate it into embedded RF systems.
3. Conclusion
Selecting the right handheld spectrum analyzer is a process that requires comprehensive consideration of application needs, key performance parameters, ease of use, and long-term support. The HAROGIC PX series of handheld spectrum analyzers, with its wide frequency range, excellent performance, portable and reliable design, and capability for secondary development, aims to extend your RF boundaries.
We invite you to visit the official HAROGIC website (www.harogic.com) or contact our sales representatives for more detailed product information.
Featured News

-01-scaled.png)


Request
For Contact.